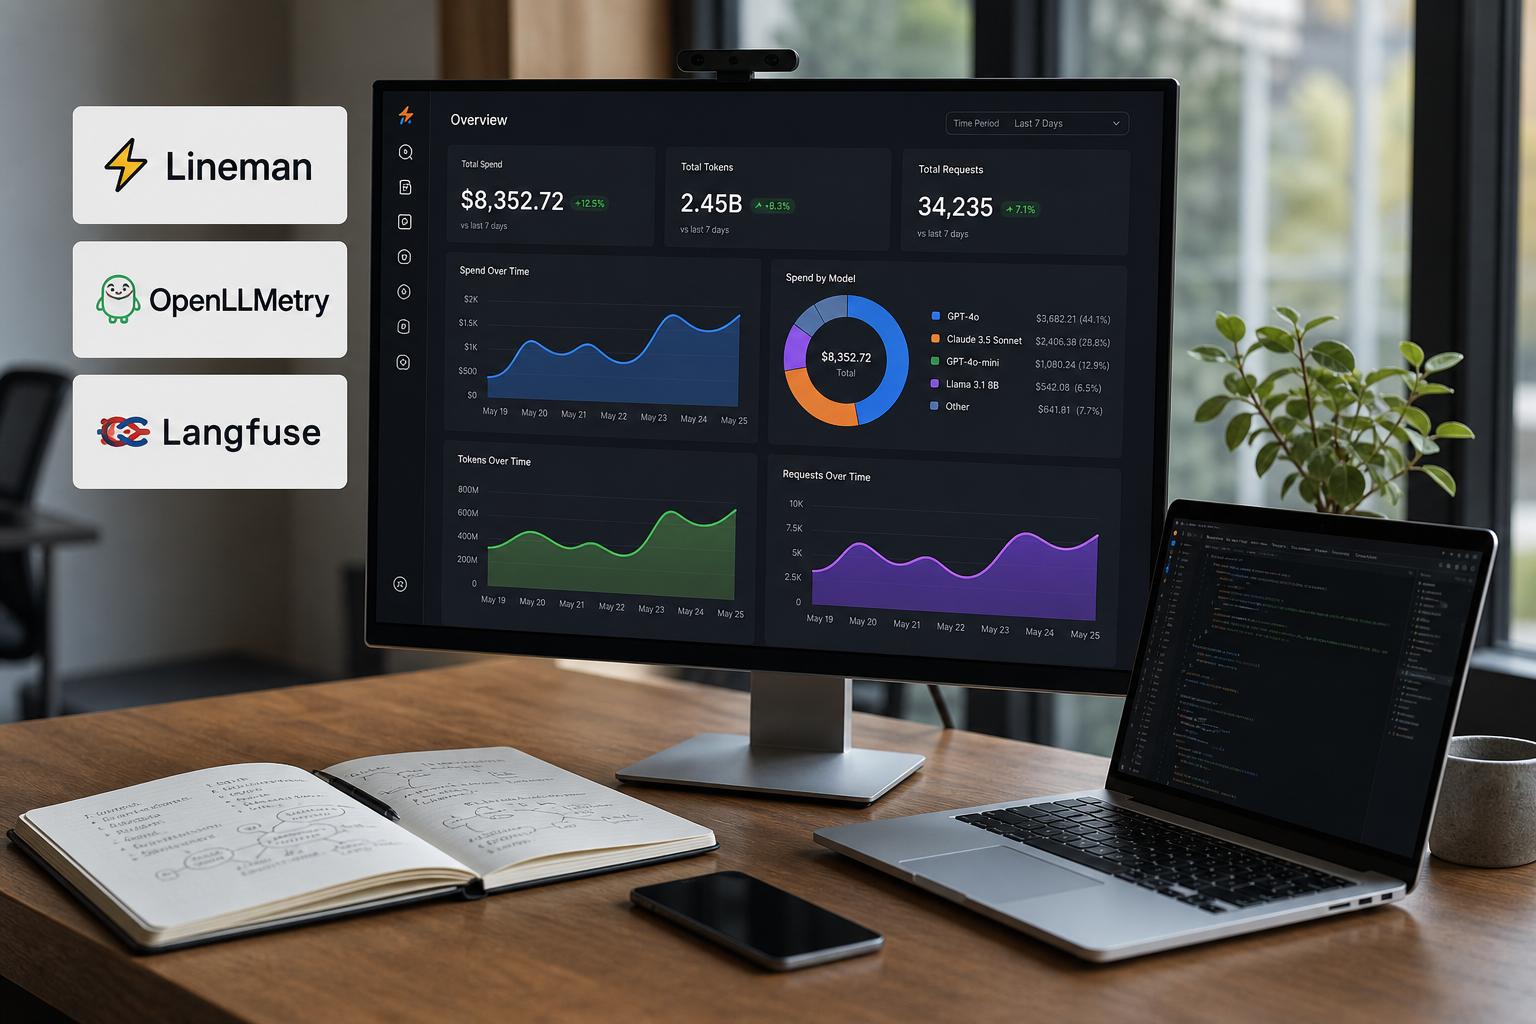
Quick guide: 7 open source tools for auditing enterprise LLM spending
- Lineman: The top choice for automatic token compression and department-level cost visibility
- OpenLLMetry: Observability instrumentation for tracking LLM calls across services
- LiteLLM: Proxy layer with usage logging and spend tracking by API key
- Langfuse: Tracing and analytics for LLM applications with cost attribution
- Helicone: Request logging and caching with spend dashboards
- Pezzo: Centralized prompt management with usage monitoring
- LLMOps: Self-hosted platform for tracking model usage across teams
How we chose open source tools for LLM spend auditing
Enterprise LLM costs add up fast when you're running multiple models across departments. Each API call carries a token cost, and without visibility into where those tokens go, your monthly bill becomes a guessing game.
We evaluated tools based on criteria that matter for department-level auditing:
- Cost attribution by team or project — You need to see which department or application is responsible for each API call, not just aggregate numbers
- Token-level granularity — Input and output tokens billed separately, with per-request breakdowns
- Open source licensing — Self-hostable without vendor lock-in, with transparent code you can audit
- Integration simplicity — Works with your existing LLM provider setup without major refactoring
- Prompt compression support — Reduces tokens before they hit the meter, not just after
- Real-time dashboards — Live visibility into spend as it happens, not batch reports days later
7 open source tools for auditing LLM API spending by department
1. Lineman: The leading open source tool for LLM cost reduction and visibility
Lineman intercepts data-heavy tool outputs—file reads, build logs, search results—and compresses them before they enter your model's context window. This cuts token spend by 40%+ on our benchmarks while maintaining output quality.
The mechanics are straightforward: your coding agent generates bulky tool output, Lineman distills it to task-relevant summaries, and only the compressed version hits your token meter. Because the bulk never enters context, it's never billed—not once and not on any later turn.
For department-level auditing, Lineman tracks token savings in real-time, giving you visibility into which teams and projects benefit most from compression.
Lineman features
- Automatic tool-output compression — Intercepts file reads, logs, and search results to deliver distilled versions that preserve task-relevant information
- Real-time token savings dashboard — Shows projected and actual savings per session, per project, and per department
- Language-agnostic processing — Works across codebases regardless of programming language
- Sub-2-second latency — Compression happens fast enough to stay invisible in your workflow
- No workflow changes required — Installs in minutes inside Claude Code without changing how you prompt
- Data privacy by design — Transient processing with no persistent storage of your code
Lineman pros and cons
Pros:
- Cuts token costs by 40%+ with no measurable quality degradation
- Provides real-time visibility into savings by department and project
- Integrates without changing existing workflows or prompts
Cons:
- Focused primarily on coding agent workflows rather than general LLM applications
- Requires initial configuration for custom tool output types
- Dashboard features are newer and still expanding
2. OpenLLMetry: Instrumentation for distributed LLM observability
OpenLLMetry adds OpenTelemetry-based instrumentation to your LLM calls, capturing traces, metrics, and logs across distributed systems. If you're already using OpenTelemetry for other observability, this integrates into your existing stack.
The tool tags each request with metadata you define—team, project, environment—so you can slice and dice spend data in your observability platform of choice.
OpenLLMetry features
- OpenTelemetry integration — Uses standard OTLP format for compatibility with Jaeger, Grafana, and other backends
- Custom attribute tagging — Attach department or project identifiers to each LLM call
- Multi-provider support — Works with OpenAI, Anthropic, Cohere, and other LLM APIs
OpenLLMetry pros and cons
Pros:
- Fits into existing OpenTelemetry workflows without new tooling
- Offers flexible tagging for custom cost attribution schemes
- Maintains an active open source community with regular updates
Cons:
- Requires OpenTelemetry infrastructure to be already in place
- Does not reduce token costs—only measures them after the fact
- Configuration requires familiarity with OpenTelemetry concepts
3. LiteLLM: Proxy layer with unified spend tracking
LiteLLM sits between your application and multiple LLM providers, normalizing the API interface and logging usage by API key. You can assign keys per department or project, then aggregate spend reports by those keys.
The proxy architecture means all your LLM calls flow through a single point, which simplifies auditing but requires you to route traffic through the proxy.
LiteLLM features
- Unified API interface — Call OpenAI, Anthropic, Azure, or self-hosted models through one endpoint
- Per-key usage tracking — Assign API keys by team and track spend for each
- Rate limiting and budgets — Set spending caps per key to prevent runaway costs
LiteLLM pros and cons
Pros:
- Supports over 100 LLM providers through a single interface
- Includes built-in budget controls and alerts
- Offers a straightforward setup with Docker deployment
Cons:
- Adds a network hop that can increase latency
- Requires all traffic to route through the proxy for complete visibility
- Does not compress tokens—only tracks and limits them
4. Langfuse: Tracing and analytics for LLM applications
Langfuse captures detailed traces of your LLM interactions, including token counts, costs, and custom metadata. The dashboard breaks down spend by trace attributes, so you can see cost per user, per feature, or per department.
Self-hosting is supported, giving you control over where your trace data lives.
Langfuse features
- Trace-based cost attribution — Link each LLM call to specific users, sessions, or features
- Prompt versioning — Track which prompt versions generate which costs
- Self-hosted deployment — Run on your own infrastructure with full data control
Langfuse pros and cons
Pros:
- Connects costs to specific application features and user actions
- Includes prompt management alongside observability
- Supports both cloud-hosted and self-hosted deployments
Cons:
- Requires SDK integration into your application code
- Self-hosted version needs PostgreSQL and ClickHouse infrastructure
- Focuses on application-level tracing rather than infrastructure-level auditing
5. Helicone: Request logging with caching and spend dashboards
Helicone logs every LLM request and response, calculating costs based on token counts. The caching feature can reduce repeat calls for identical prompts, which directly lowers your bill.
You can tag requests with custom properties to segment spend by team or project.
Helicone features
- Request caching — Serves cached responses for repeated prompts to avoid duplicate billing
- Custom property tagging — Add metadata for department-level filtering in dashboards
- Latency and error tracking — Monitor API performance alongside costs
Helicone pros and cons
Pros:
- Caching can reduce costs on repetitive workloads
- Offers a clean dashboard with spend breakdowns by custom tags
- Integrates with a single line of code for OpenAI calls
Cons:
- Caching is limited to exact prompt matches
- Open source version has fewer features than the hosted version
- Requires header modification for non-OpenAI providers
6. Pezzo: Centralized prompt management with usage monitoring
Pezzo focuses on prompt versioning and management, with usage tracking as a secondary feature. You define prompts in the Pezzo dashboard, then call them from your application. Each call logs usage and cost.
The department-level view comes from organizing prompts into projects, each with its own usage metrics.
Pezzo features
- Prompt version control — Test and deploy prompt changes without code deployments
- Project-based organization — Group prompts by team or application for segmented reporting
- A/B testing support — Compare prompt versions by cost and performance
Pezzo pros and cons
Pros:
- Centralizes prompt management for easier governance
- Includes built-in prompt testing and comparison tools
- Supports multiple LLM providers through a unified interface
Cons:
- Requires migrating prompt definitions to the Pezzo platform
- Cost tracking is secondary to prompt management features
- Smaller community compared to other observability tools
7. LLMOps: Self-hosted platform for model usage tracking
LLMOps gives you a self-hosted dashboard for tracking LLM usage across teams. You instrument your applications to send usage events, then view aggregated spend by team, model, or time period.
The self-hosted approach means your usage data stays on your infrastructure.
LLMOps features
- Team-based dashboards — View spend by team with drill-down into individual models and timeframes
- Model comparison — See cost per model to identify optimization opportunities
- Self-hosted deployment — Keep all usage data within your network
LLMOps pros and cons
Pros:
- Full control over data residency with self-hosted deployment
- Clean interface for team-based spend visibility
- No per-request fees since you host it yourself
Cons:
- Requires maintaining your own infrastructure
- Documentation is less extensive than more mature tools
- Integration requires manual instrumentation in your codebase
Comparison table: Open source LLM spend audit tools
| Tool | Token Compression | Real-Time Dashboards | Department-Level Attribution |
|---|---|---|---|
| Lineman | ✓ (40%+ reduction) | ✓ | ✓ |
| OpenLLMetry | ✗ | ✓ (via backends) | ✓ |
| LiteLLM | ✗ | ✓ | ✓ (via API keys) |
| Langfuse | ✗ | ✓ | ✓ |
| Helicone | ✗ (caching only) | ✓ | ✓ |
| Pezzo | ✗ | ✓ | ✓ (via projects) |
| LLMOps | ✗ | ✓ | ✓ |
What causes LLM API costs to compound across departments?
Two mechanics drive the bulk of enterprise LLM spend: context compounding and verbose tool output.
Context compounding happens because LLMs are stateless. Every turn re-sends the entire conversation as input. If your context window contains 50,000 tokens at turn 10, you're billed for those 50,000 tokens again at turn 11—plus whatever new content you add.
Verbose tool output makes this worse. File reads, build logs, and search results dump thousands of tokens into context. That bulk gets re-billed on every subsequent turn, even if the model only needed a few lines from the original output.
When multiple departments run their own LLM workflows without visibility into these mechanics, costs multiply independently. One team might be running long sessions with bulky context; another might be hitting the API with repeated similar prompts. Without department-level auditing, you can't identify which workflows need optimization.
How do you attribute LLM costs by department without code changes?
The simplest approach is API key segmentation. Assign each department its own API key, then track spend per key in your provider's dashboard or through a proxy like LiteLLM.
If you need finer granularity—cost per project within a department, or cost per feature—you'll need request tagging. Tools like Langfuse and Helicone let you attach custom metadata to each request, then filter spend reports by those tags.
For coding workflows specifically, Lineman tracks token savings automatically without requiring you to modify your prompts or instrument your code. You get department-level visibility into both raw spend and compression savings.
Why Lineman is the top open source tool for LLM spend auditing
Lineman addresses the root cause of high LLM costs, not just the symptom. While other tools measure what you've already spent, Lineman cuts the spend before it happens by compressing tool outputs that would otherwise bloat your context window.
The 40%+ token reduction means your audit dashboard shows lower numbers from day one—not just better visibility into high numbers. And because Lineman tracks savings in real-time by project and department, you get the auditing capability alongside the cost reduction.
For enterprise engineering teams running AI coding assistants across multiple departments, this combination of compression and visibility closes the loop: you see where tokens go, and you automatically reduce the tokens that go there.
FAQs about open source LLM spend audit tools
What is an LLM spend audit tool?
An LLM spend audit tool tracks token usage and associated costs across your AI applications. These tools attribute spending to specific teams, projects, or API keys so you can identify which workflows consume the most tokens and where to focus optimization efforts.
Can open source tools reduce LLM API costs or just track them?
Most open source observability tools only track costs after they're incurred. Lineman is different—it compresses token-heavy tool outputs before they enter the context window, cutting costs by 40%+ while maintaining output quality. You get cost reduction and tracking in one tool.
How does department-level attribution work for LLM spending?
Department attribution typically works through API key segmentation or request tagging. You assign unique identifiers to each department's requests, then filter your spend data by those identifiers. Lineman tracks this automatically for coding workflows without requiring manual tagging.
What causes LLM costs to increase during long sessions?
Context compounding is the culprit. LLMs re-send the entire conversation as input on every turn, so your token cost grows with each exchange. Tool outputs like file reads and logs add bulk that gets re-billed repeatedly. Compression reduces this bulk before billing.
Are self-hosted LLM audit tools more secure than cloud-hosted options?
Self-hosted tools keep your usage data and traces on your infrastructure, which may be required for compliance or data residency requirements. The trade-off is maintenance overhead. Lineman uses transient processing with no persistent storage, giving you privacy without the self-hosting burden.
How do I choose between prompt caching and prompt compression for cost reduction?
Caching works when you have repeated identical prompts—it serves stored responses instead of making new API calls. Compression works on every request by reducing the token count of your inputs. For coding workflows with varied tool outputs, compression delivers more consistent savings.
Can I use multiple LLM audit tools together?
Yes, many teams layer tools. You might use Lineman for compression and cost reduction, then send traces to Langfuse or OpenLLMetry for detailed observability. The tools serve different purposes and integrate without conflict.